Building Interactive Data Visualisation for Process Aware Workforce Analytics
Dyllon Tan
Supervisors: Dr Roy Yang and Assoc Prof Chun Ouyang
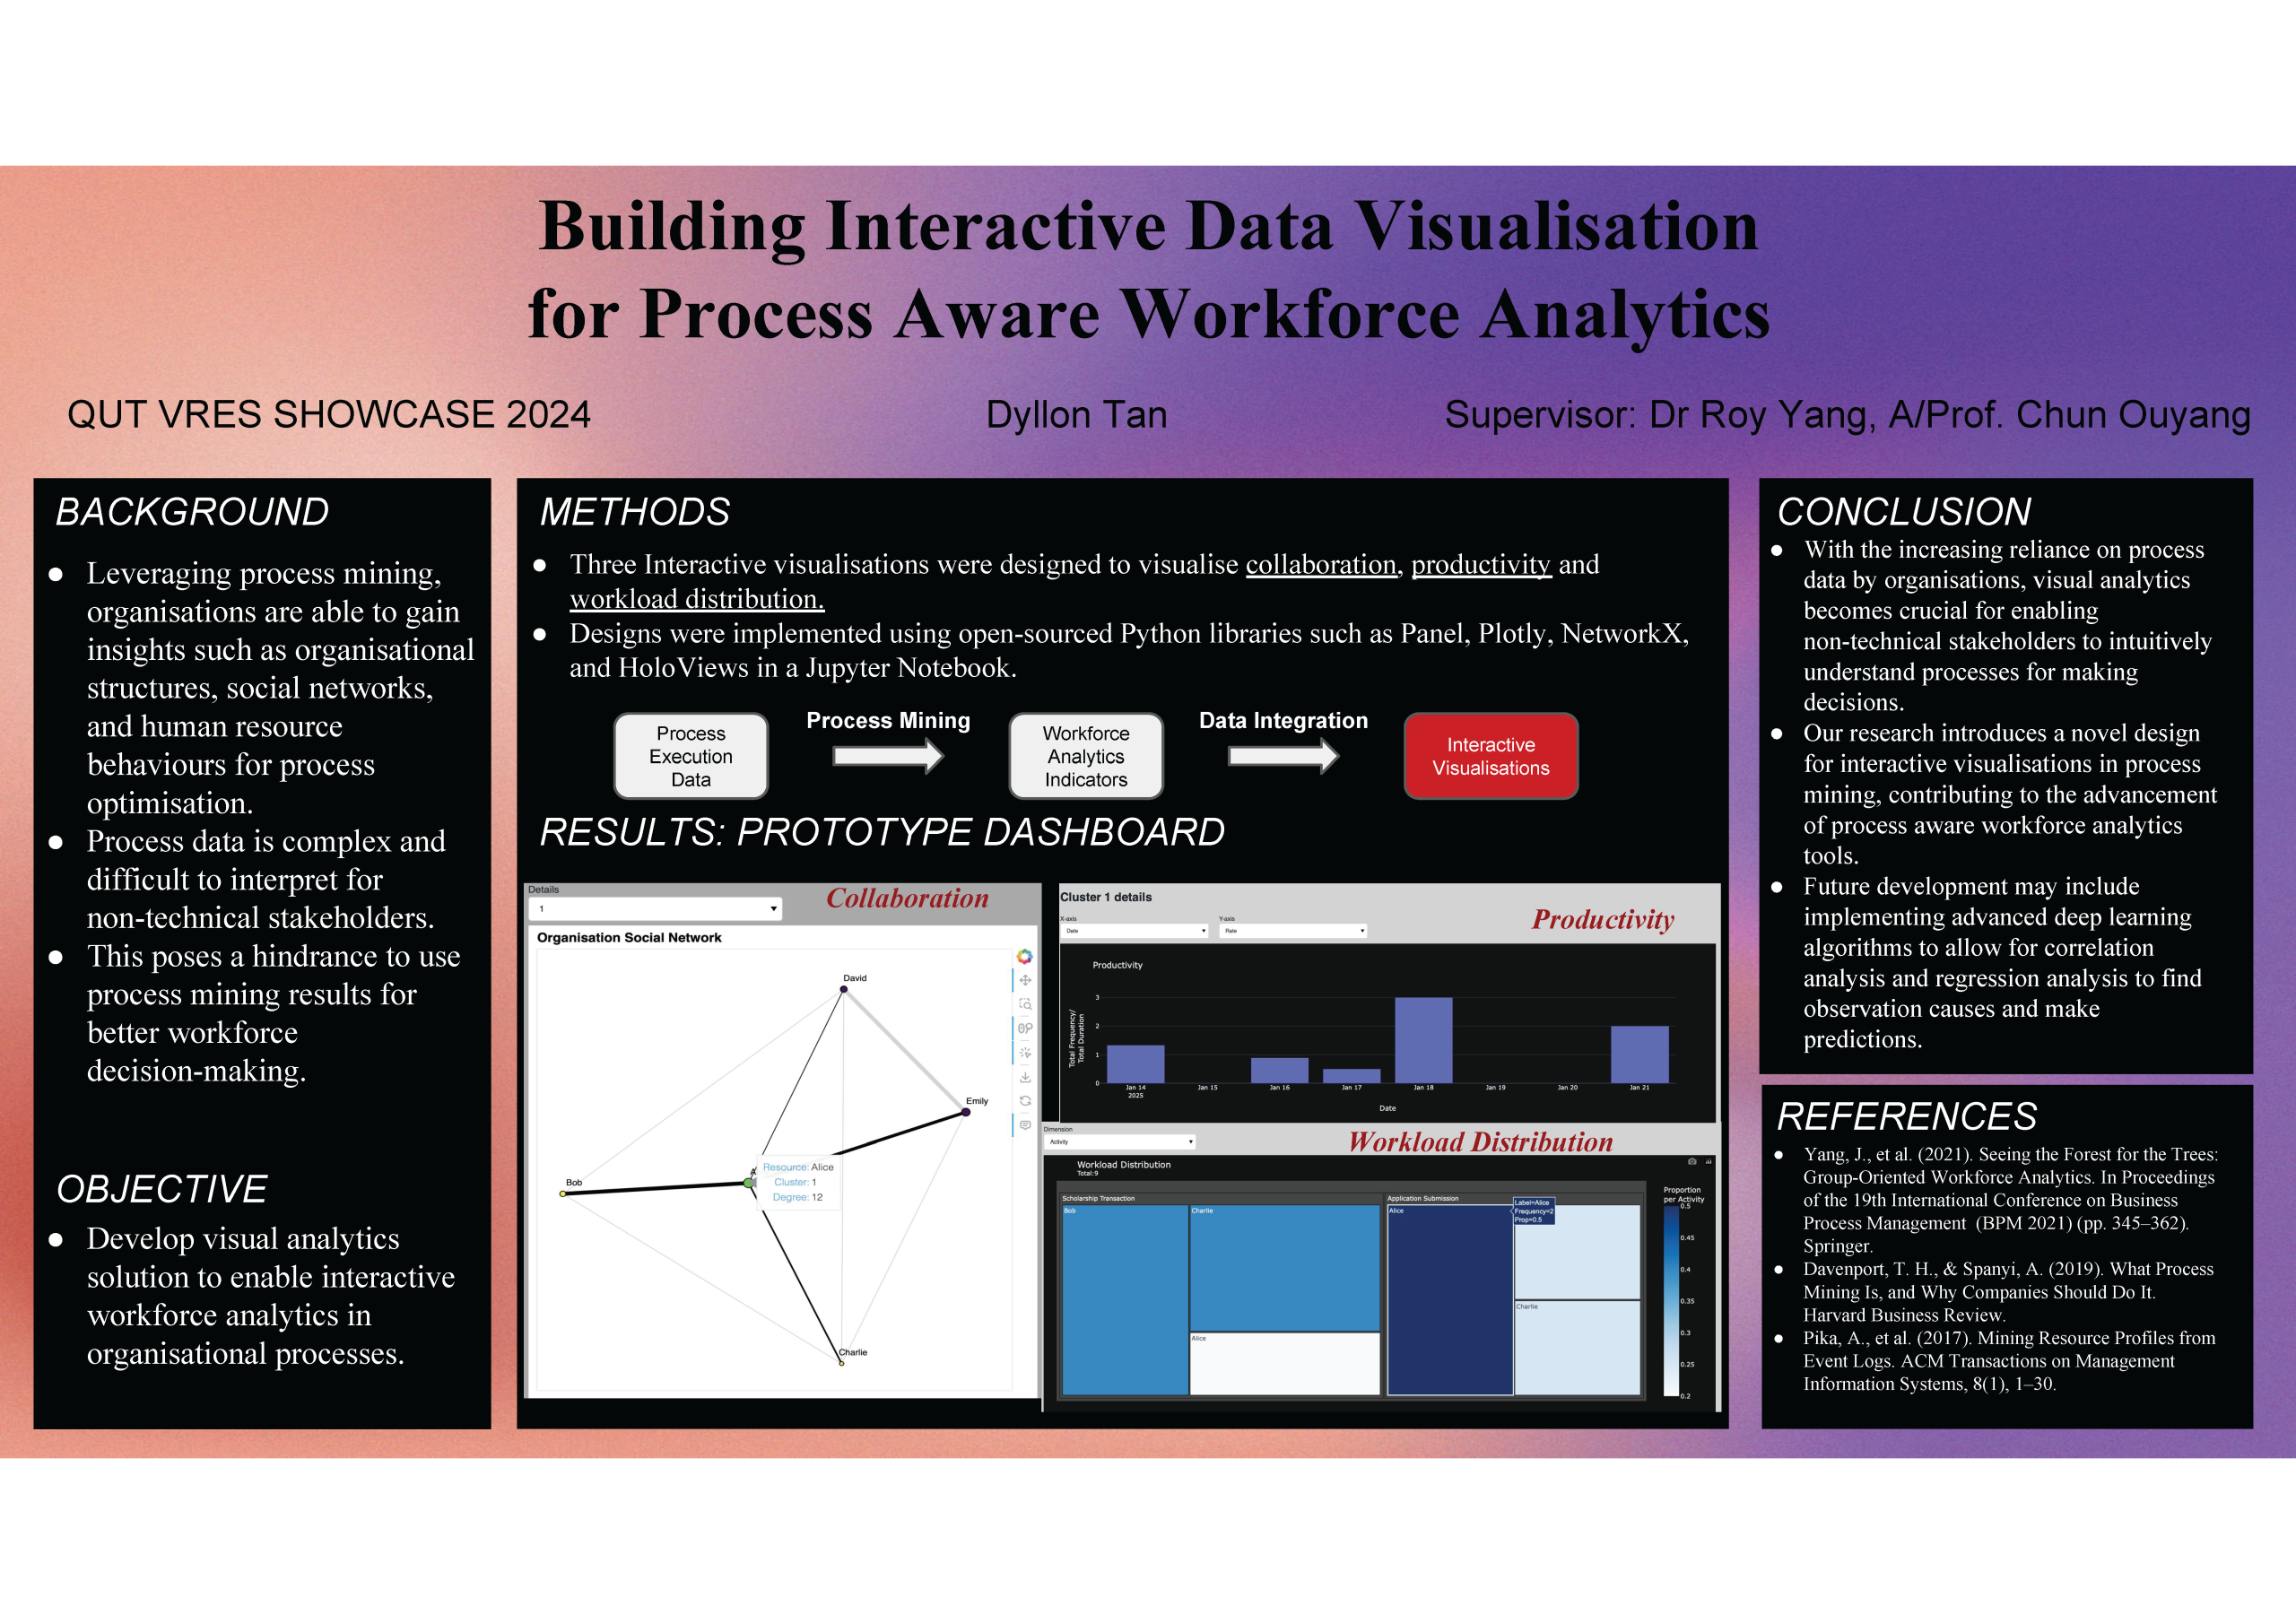
Process mining provides organisations with a novel means to support their workforce analytics. Using process mining, organisations can gain a deeper understanding of their organisational structures, employee social networks and human resource behaviours by drawing insights from process execution data stored in event logs. However, given the voluminous and complex nature of process data, there is a crucial need to translate the derived results to non-technical organisation stakeholders. We believe that combining visual analytics with process mining can effectively bridge this communication gap and facilitate better decision-making within organisations.
In this research, we propose an intuitive visual analytics solution in the context of process mining that primarily focuses on three key aspects of workforce analytics: collaboration, productivity, and workload distribution. The proposed solution consists of a weighted, undirected network chart to visualise the collaboration across resources, a tree map to visualise group workload distribution and bar charts to visualise group productivity as well as the workload distribution and productivity of individual members. Interactivity functions are embedded in the visualisations to allow users to intuitively investigate patterns and compare performance across groups and individuals by different measures and dimensions. For example, users may employ the proposed solution to understand the collaborations between two organisational departments and infer resource specialisations based on their productivity and workload. The proposed solution has been implemented in a Jupyter Notebook for ease-of-use, applying open-source Python software libraries including Plotly, NetworkX and HoloViews. Our research presents a new design of interactive visualisations for process mining research and contributes to the development of process mining tools for workforce analytics. 
Media Attributions
- Building interactive data visualisation for process aware workforce analytics © Dyllon Tan is licensed under a CC BY-NC (Attribution NonCommercial) license

